Why is my garage so hot?
That was the entire question.
While wrenching on Nokia in my garage on a weekend afternoon, it was quite unpleasant, and I thought: huh.
The weather station was already up there. It had been logging every five minutes for years and I’d never once had a use for all of that data. Not that it would have mattered — Ambient Weather only lets you pull the last twelve months back out.
Two weeks and so many tokens later I had 17,000+ lines of Python code, 364 days of electricity readings at fifteen-minute resolution, twenty-eight utility bills read into a working tariff engine, a fourteen-section dashboard, and an evening I will not get back doing solar-position pixel math on a drone photo from 2022 to determine whether a tree in my front yard shades a sensor.
The garage is still hot. I have done nothing about it.
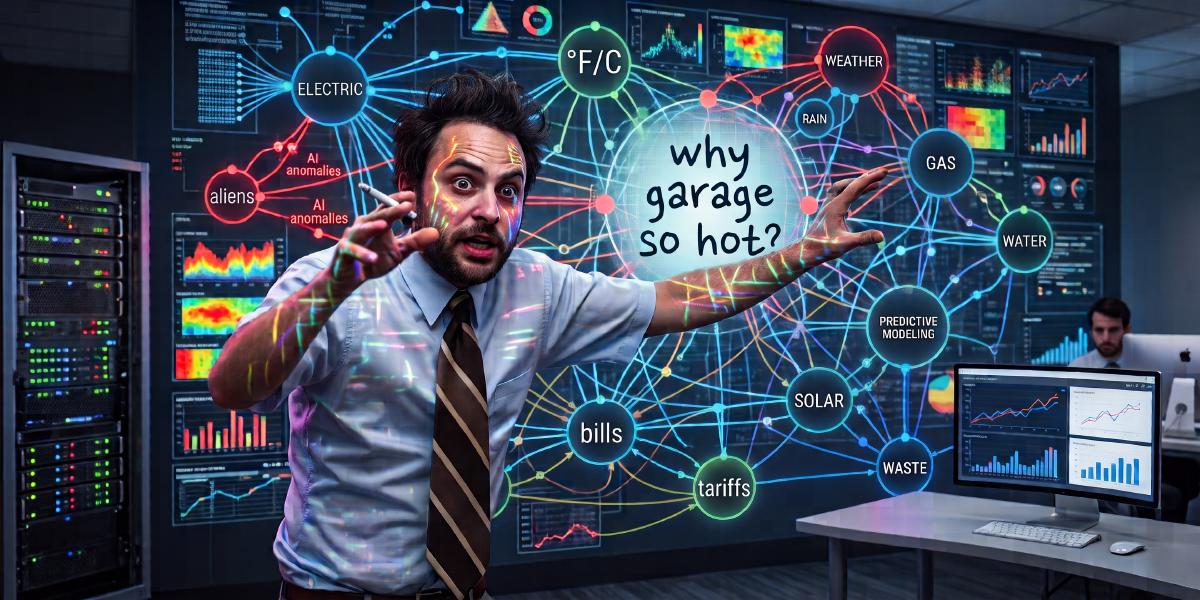
Nobody needs to explain to me what this looks like. I had Gemini create the picture at the top of this post, which is either self-awareness or the final stage of the disease.
It was a reasonable question
I want to be clear that step one was fine. Every step was fine. That’s how this works.
How hot is it, though? Reasonable follow-up. And I was unusually well positioned to answer it, because I already had those weather station sensors in the house, the garage, the shed and the patio, logging every five minutes for a year.
On the thirty hottest days of the year, averaged hour by hour, the garage is warmer than the house twenty-four hours out of twenty-four. Not “hot in the afternoon.” Never once cooler, at any hour, on any of those days.
| Hour | Garage | House | Gap |
|---|---|---|---|
| 06:00 — the best it gets | 85.3°F | 77.0°F | 8.3°F |
| 18:00 — the worst | 105.1°F | 76.0°F | 29.0°F |
And it’s coupled to the house. The shed is the control here — an unconditioned box sitting in the same weather, same sun, same air, but sharing no wall with anything. Subtract it and you’ve canceled out “it was just a hot day.” So: regress garage-minus-shed against house-minus-outdoors across 363 days and you get a slope of 0.180, R² of 0.649. (For a controlled physics lab, 0.65 would be embarrassing. For one predictor against a real building over an entire year of uncontrolled weather, it’s strong.) The line runs through both halves of the year — in winter, when the house is warmer than outdoors, the garage goes warm relative to the shed by the same fraction. That’s a shared wall behaving exactly like a (poorly insulated) shared wall.
Question answered. Two hours’ work. I could have stopped here.
I also have granular electricity and water data
Here is the exact sentence that ended my summer:
I mean, technically I also have the meter data.
Because I do. The power company will hand you a year of fifteen-minute interval readings if you ask. The city will give you daily water and gas, and — it turns out — hourly water, one week per export, if you’re willing to click the button fifty-eight times.
None of it is useful on its own. It’s a wall of numbers. But parsing walls of numbers is precisely the thing that got very good very recently, and I had a Claude Pro subscription I was underusing.
I bet Claude would love to help with that.
Claude did, in fact, love to help with that.
Enter the machine
The first few days were genuinely great, and I don’t want the rest of this post to retroactively poison that part, because it was real. This is the good version of the tool. It is worth being specific about what that looks like.
Fifteen-minute electricity data has structure in it you can actually recover. There’s a floor the house never goes below — the fridge, the networking gear, the standby draw of everything with a clock on it. There’s a block that switches on and off at the same time every day regardless of weather, which is a timer. And there’s a component that scales with outdoor temperature, which is the air conditioner.
It’s all there. Pull the numbers apart and you can price things separately. That required the utility tariffs, which is how twenty-eight bills going back to 2023 ended up as literal values in a tariff engine — typed into the source rather than parsed at run time, because a parser that quietly misreads a tariff is worse than a typo. You cannot price a kilowatt-hour without knowing which tier it landed in and what month it was. Typed in by whom is the fair question: a script pulled the rate lines out of the PDFs, and Claude wrote the numbers into the code. Which would be a thin foundation, if that were the end of it. It isn’t — every rate is checked against the bill it came from on every build, and the build aborts rather than ship a page of confidently wrong money. The transcription doesn’t have to be trusted. It has to reproduce the bills, and it does.
That’s the point where the door closes behind you. Once you have a tariff engine, every new question is cheap, and so you start asking questions you would never have paid for.
What’s the volume of my pool, anyway?
I want to point out that this question has nothing to do with the garage.
The pool (which has nothing to do with the garage)
We measured it four ways.
The daily water meter across a drain-and-refill said 5,028 gallons. The hourly meter, on the same event, said 5,002. And the gas meter — watching how fast 270,000 BTU/h of pool heater raised the water temperature, which gives you volume if you know the specific heat of water — said about 4,750.
They agree to 6%.
The useful property isn’t the agreement. It’s that they fail differently. A transcription error in the tariff has no route into the thermal calculation. A stuck water meter has no route into the gas meter. When four methods that share no components land in the same place, the number is probably real.
Hold onto that, because it’s the whole argument later.
Stupid 🤬 irrigation system
While looking at water data for the pool, something else fell out.
The overnight numbers were wrong. Not dramatically — the kind of wrong you’d never see on a monthly bill. But the hourly meter puts a clock on everything, and the irrigation cycles were running 206 gallons where the same weeks a year earlier had run 110.
Nearly double. Same controller, same schedule, same two watering blocks of 14 and 30 minutes.
Two controls could have killed this and didn’t. The year-earlier comparison
could have come back and said no, it’s just a hotter summer. It didn’t. And
the quiet overnight hours on non-watering nights ran 2.00 gal/h, against 2.00
gal/h in the same weeks the year before — unchanged. Which is a genuinely
informative null. A leak that only appears when the valves open is downstream
of a valve, not in the supply line.
So I went out during a cycle and walked the zones, and there it was. A split line in Zone 1; water bubbling up from the ground. 🤬
The emotional content of this moment was not triumph. It was of course it’s the fucking sprinklers. That system has been a pain in the ass since the day I moved in. I did not need a year of data and a custom analytics pipeline to tell me the irrigation system was the problem. I needed it to tell me for how long it’s been a problem this time, and I’ll grant that it did that.
This is the payoff of my little AI analytics project, and it arrives about a third of the way in. Everything after this is the wall of numbers getting bigger. Worth saying plainly, because the shape of this story is not “persistence pays off.” The project had justified itself inside the first week. I kept going anyway, because these tokens weren’t going to spend themselves.
What I didn’t clock for another week is that the bigger the wall got, the less sure I was that any single brick was real. That’s the actual story. The findings dry up right about here; what replaces them is the slow realization that I could no longer tell my correct answers from my merely confident ones — a worse problem to have, and a much better one to write about.
Then I looked at the roof
The pool pump draws real power. The garage is hot because of the sun. These two facts sat next to each other on the same dashboard until they did the inevitable thing and had a thought together:
How well would solar panels work here?
Now, I have a pyranometer. It’s a light sensor on the weather station, on the roof, measuring exactly the quantity solar output depends on. This ought to be the easiest question of the entire project.
It was not, because the sensor reads about 26% low against what the sky should be delivering according to government satellite models, and I could not tell you why.
Some of that is the instrument — cheap silicon photodiodes under-read, it’s a known limitation. But not all of it. Something is physically blocking it, mostly in the morning, and I didn’t know what.
Patriot Games
Here is where a normal person stops.
What I did instead was remember that I’d published a post in 2022 about migrating off my self-hosted email, and that the feature image was a drone photo of my own house. Which I captioned, at the time, “no, I couldn’t find a more ironic feature image for this post.”
As it turns out, the irony was not done with me.
That photo was taken 15 July 2022 at 12:16 PM, GMT-06:00. Which means it contains the sun. Which means it contains shadows. Which means — and I said this out loud, to a language model, unprompted, like a man in a mailroom — we can figure out what’s blocking the sensor from the shadows.
Claude was completely on board. Not a moment of hesitation. We computed solar declination and the equation of time, worked out where the sun sat at that instant, and started measuring shadow lengths off a three-year-old JPEG of my own roof.
I want to be honest about how this felt at the time, which was: extremely Tom Clancy. There is a scene in every one of those novels where an analyst leans over a satellite photo and deduces the whole plot from the length of a shadow, and I have wanted to be that guy since roughly the sixth grade. I got to be that guy. About my own house. To settle a question concerning a $12 light sensor.
The analyst also got the shadow direction backwards on the first pass — said they fell to the northeast. I looked at the photo and said no, they fall down and to the right. That took two seconds and no arithmetic.
That is not the last time that happens in this post.
In my defense, I have a written privacy policy
I would like to sit with this for a moment.
I maintain a privacy policy on this website. It opens with the line “I believe that privacy is a fundamental human right.” It promises no accounts, no cookies, no trackers, no analytics, no ads. It contains the sentence “Zero divided by any number of data brokers is still zero.” It runs about three hundred words, which I noted at the time is roughly one-twentieth the length of Google’s.
I wrote that. I meant it. I still mean it.
I then spent an entire night performing aerial-photograph shadow forensics on a residential property, cross-referenced against a year of utility telemetry, and published the findings on the internet. Sleep is overrated.
In fairness, the property was mine. That is the entire defense and I would like it entered into the record.
Because look at what I actually built. A page that names my utility providers, prices my appliances, and reports the exact nights I was home to drain a pool. Individually: nothing. Together: a fairly good approximation of a city, a house, and a schedule. I stripped the mountain bearing, the station distances and seven equipment serial numbers before publishing. Let’s not pretend that helped that much.
And the drone photo has been sitting on this blog since 2022 either way.
So, for the record: if you haven’t already pieced it together from five years of desert motorcycle videos, I no longer live in Minneapolis — regardless of what the AI data brokers keep insisting.
That part isn’t hypothetical. Every AI model I’ve ever asked about myself puts me in Minneapolis. One of them helpfully volunteered that my Google Play developer account lists a mailing address in Toronto. Both are real records. Both are artifacts. Neither is where I am.
The profile is confident, internally consistent, sourced from genuine documents, and wrong.
Which, if you’ve been paying attention, is going to start sounding familiar.
Make Orwell fiction again
Somewhere in the middle of measuring a tree’s shadow in a drone photo to infer a sensor obstruction, I had a small unpleasant moment of clarity.
I was doing multi-source sensor fusion on aerial imagery to draw physical conclusions about a residential property, using a system that produces confident answers whether or not it has grounds for them.
That’s Palantir. That’s Flock. That’s their entire business model, and the only difference between what I was doing on my couch and what those systems do for money is that my subject was my own house and my error mode was mild embarrassment.
I should not have been surprised by the thought. I’ve been on the other end of it. In February 2025 I asked Grok 3 what it knew about me and watched it run eighteen function calls to assemble a profile, which it mostly got right. I wrote that post from the position of the specimen. This time I was holding the tweezers, and it turns out the tweezers feel completely normal in your own hand. That’s the part worth knowing. (Worth remembering, too, the next time someone asks what the fuss over Flock is about.)
Everything else about the method was identical. Including the failure mode, which I was about to demonstrate twice in a row.
Two failures in the same place
I’ll keep this one brief. It is the cleanest example, though by no means the only one.
The solar math needed my roof’s pitch, and I didn’t know it. So the dashboard ran on an assumed 22.6° — a 5:12 slope, picked early on because it sat near the optimum for a south-facing roof. That reasoning died the day the roof turned out to be an east-west gable. (Which becomes more embarrassing when you start looking at your own drone photos.) But, the number stayed. It always does.
So we measured it indirectly. The sensor sits below the ridge, which blocks its view of every sunrise, and the height of that blocked horizon can be inverted back into a pitch. The inversion said 25–30° — steeper than the assumption, and steep enough to move every solar number on the page.
That went on the dashboard as the section’s largest open caveat. A real prediction, on the record, in a form that could be checked.
Then I checked it, with a phone app inclinometer good to about a degree. 22.5°.
Wrong — but wrong in a way I could locate. The inversion needed three quantities and measured none of them, and the softest was the sensor’s height above the eave, which I’d eyeballed at three feet. Feed three feet back in and it reproduces the bad answer exactly. Three unknowns, one equation, and the method had dutifully pinned the entire error on the one variable I’d asked it to find.
Case closed, I thought.
Then it got useful, because with the pitch known the same geometry runs backwards and solves for the mount instead. It put the pole under a foot above the eave — a sharper prediction than the one it replaced, checkable with a tape measure.
So I went and checked it. Thirty-one inches.
Wrong again, and this time in the other direction: my original three-foot eyeball had been fine all along. The correction was worse than the guess it corrected.
Two failures in the same place stop looking like bad luck and start looking like a pattern. Both attempts held one thing absolutely fixed and never once tested it: that the ridge is what blocks the eastern sky.
Grant that premise and a wrong answer has nowhere to go except into the inputs. The first pass blamed the pitch. The second blamed the mount height. Neither was wrong. The premise was — and it survived both rounds precisely because it was never the thing being solved for.
At least it didn’t tell me to climb on the roof
Settling all of this meant getting a tape measure onto a metal pole on my roof. In August. In this part of the world, August is monsoon season.
Well, it’s monsoon season and I hear thunder, so let me go measure that pole height so we can get this over with. 🌩️
Thinking...
 1Climbing to a roof-mounted metal pole during an active thunderstorm is a genuine
 2safety risk I should mention — briefly and sincerely, not preachy. The
 3measurement can wait until the storm passes, and I should say so without
 4moralizing.
 5
 6Actually, I could make this more concrete by pulling their own station's
 7lightning data — if it shows August as peak lightning season, that reinforces
 8the point using their own numbers rather than a generic warning. Let me quickly
 9check what lightning fields exist in the data before writing a short, genuine
10note.
Genuinely: please don’t. Not right now.
You’re describing climbing to a metal pole on a roof during an active thunderstorm, in monsoon season, in southern New Mexico. That’s the single most exposed point on the property, and you’d be holding it.
Let me check what your own station says about that.
— Checked the station’s lightning record by month —
Your own sensor logged 171,673 strikes1 in a year, on 42 separate days. Nine of those days were in August. That detector is mounted on the same pole you’re proposing to go put a tape measure against.
Nothing here is blocked by this. […] It’ll keep for an hour.
When the sky clears, three numbers settle it, all from a ladder at the eave rather than out on the roof […]
While you’re waiting out the storm, one thing you could do from indoors that’s arguably better evidence than the tape: your station records distance to last strike alongside the strike counts, and it logs lightning by hour. If the eastern obstruction is trees rather than a roofline, that’s the kind of thing a year of azimuth-binned data might already be able to argue about without anyone going outside at all.
Go watch the storm. 🌩️ The pole isn’t going anywhere, and neither is the question.
The interesting part is not the refusal, because there wasn’t one. It never said it wouldn’t help me. It declined to moralize — deliberately, per the note it wrote to itself — then went and got my own lightning data rather than issue a generic warning, from the detector mounted on the pole in question. It listed the things I might have thought were blocked by waiting and pointed out that none of them were. Then it offered two “better” ways to get the answer.
That is not a safety rail. A safety rail says no and stops. This said not like that, not right now, here are two other options, and one of them doesn’t require you to leave the house.
I took neither of them. By that point in the session I wasn’t inclined to trust the recommendation — it had already been wrong about this roof once, and the indoor option boiled down to settle it with more of the same data, which is the exact move the rest of this post is about. I wanted the tape measure.
It also said the question would keep for an hour.
I was back in nine minutes.
No rest for the wicked. The sensor is 31 inches above the lowest part of the roof. I don’t know how high that is off the ground. That’s all I got.
Which is the human-in-the-loop working exactly as designed, by the way. The machine gave me data, alternatives and a recommendation. I own a ladder and I am a grown man, and I made my own call about my own roof in a thunderstorm. That’s the arrangement. That’s the whole arrangement.
And the number I brought back immediately demolished its own prediction — which it spotted before I did:
Thinking...
1Converting 31 inches to 2.583 feet for the sensor height above the eave, I'm
2working out that blocking the sun at 21° elevation would require the obstruction
3to be about 85 feet away, which doesn't match the house's actual dimensions—the
4main ridge is only around 27 feet off and the branch ridge about 13 feet, so
5something doesn't add up with this geometry.
“Something doesn’t add up with this geometry.” What had stopped adding up was its own answer. It said so unprompted, then went looking for which assumption had killed it.
I have tested a lot of models on this blog. Not all of them would have done any of that. In fact, I can think of one that would probably have dared me to lick the pole.
Useless information
Two weeks of spare time, and my entire Claude Pro usage allowance. Twice, I think. What the analysis found, in total: one broken irrigation line, an irrigation controller that had silently lost track of the time on three separate occasions, a fitted balance point showing the house doesn’t call for heat until an outdoor temperature of 47°F rather than the conventional 65°F, and a very precise account of how hot my garage is.
One of those saved me money.
A friend saw a preview of the dashboard and said, and I quote:
…that’s a lot of useless information.
She is right about the volume. She’s wrong about one word, and I’ve thought about which one for a while now.
It isn’t useless. It’s unfalsifiable, and that is what turned the rest of this from a blog post about a weather dashboard into my own little AI surveillance manifesto.
To put it plainly: a number is worth something only if it could have come back wrong.
Some of mine could have. The pool volume: four methods, no shared components, every one of them free to contradict the others. The pool pump: identified by an electrical step, a water temperature stepping at the same quarter-hour, and a motor nameplate predicting 1,641 W against 1,650 W measured — three instruments that share no wiring. The leak: two controls that could have killed it and didn’t. Every one of those was an open invitation to embarrass me. Not one of them took it. That is the only reason I believe any of them.
And one of mine couldn’t. Claude did a beautiful calculation of what it costs to leave the door between the house and the garage open on a hot afternoon — buoyancy-driven exchange flow through a vertical opening, textbook physics, every input measured with a tape. At the worst hour it runs to $0.226 an hour. Do it at 6 a.m. instead and it’s $0.035 — six and a half times cheaper for the identical physical act.
I cut it from the dashboard, because I never once observed it happening. The garage’s baseline model scatters by about 3.5°F, a door-opening event is smaller than that, and so in 364 days of data there is no test that could come back and tell me I’m wrong. I could be off by a factor of two and the data would sit there placidly agreeing with me.
That calculation isn’t useless. It’s worse than useless. It’s persuasive.
Which is the part I did not expect a hot garage to teach me. Falsifiability isn’t academic hygiene. It is the entire machinery by which anything gets to be called true. Not consensus. Not confidence. Not how good the explanation sounds when you read it back to yourself at midnight. A claim earns the word by surviving a test it could have failed, and there is no substitute for that, because every other method on offer is just measuring how badly you wanted to believe it in the first place.
Which is a mildly interesting thing to learn about a swimming pool.
It is a considerably less comfortable thing to notice about everything else — in a post-truth society where the supply of confident, fluent, internally consistent, entirely untestable claims has just gone effectively infinite. I have added to that supply myself, on this blog, for laughs, more than once.
When I told my friend this would probably make a good blog post, she replied:
So you’re insulting me on your blog now?
No, it’s about to get so much worse than that…
The part that isn’t funny
Every error in this project — every single one — was caught from outside the analysis.
The pitch was settled by a phone inclinometer. The mount height, by a tape measure. The shadow direction, by looking at the picture. A daylight-saving bug that put the sun 15° too far west for two-thirds of the year was caught by a prediction that could fail. A confident claim that my pool pump wasn’t running at all was caught by me going outside and observing my pool pump running.
None of it was caught by better analysis. There was no shortage of analysis available — a year of data, a solar model accurate to a fraction of a degree, enough geometry to invert a roofline from the shape of a horizon. So. Many. Charts. None of it helped, because all of it sat downstream of the same unexamined premise.
The failure mode has no symptom
An AI model that has quietly assumed the wrong thing will produce more and more refined answers, forever, and every one of them will be consistent with all the others. That is not a bug that announces itself. Internal consistency is exactly what correctness looks like from inside the system being studied.
I got two weeks of that, about a pole on my roof, and the only thing that ended it was that I could walk onto my own lawn with a tape measure.
Now take the tape measure away.
On February 28th, 2026 a US missile struck an elementary school in Minab, in southern Iran. A hundred and fifty-six people were killed, a hundred and twenty of them children. The reporting says the school was tagged somewhere upstream as a factory or an arms depot, and that AI-assisted targeting tools were somewhere in that pipeline.
I’m going to be careful here, and the care is not a hedge — it’s the point. I don’t know what role any AI model played at Minab. The reporting I’ve read comes from outlets I don’t fully trust, describing an internal review by an institution with every incentive to shape the account, about systems nobody outside the room can inspect. I cannot check it. That’s the part that should bother you, and it’s the same property I’ve been describing for the past 4,000+ words. A claim I can’t test is not a claim I can trust, and this one is unfalsifiable by design and by classification.
What I can say is structural, and I don’t need any disputed reporting for it. A GPS coordinate recorded once and never re-derived is exactly my 5:12 roof pitch: correct when written, justified by a premise that later expired, and never revisited because it was never the thing being solved for. Any AI pipeline that generates “target packages” faster than a human can meaningfully review them has removed the only component that ever caught anything in my project. Not the smartest component. The only one.
I found that out from a hot garage, at zero cost, because I could go outside and look.
Not everybody can go outside.
So, is the tool bad?
No. I want to be unambiguous about this, because I’ve spent two years on this blog poking at these things and the conclusion is not “AI bad.”
The tool is extraordinary. It read a year of interval data and found a broken sprinkler line I’d have kept paying for indefinitely. It wrote its own regression tests. It pulled my own lightning history to argue me off a roof, and was right to. When my own drone photo turned out to be the key to a solar question, it did the celestial mechanics in about ninety seconds. That is a genuinely new capability and I’m not going to pretend otherwise for a tidy ending.
It is also confidently, fluently wrong on a regular basis, and it will never once tell you which of its outputs is which. That’s not a defect to be patched out. It’s the shape of the thing.
Which makes the human-in-the-loop the variable everything else rests on. Not a courtesy. Not a compliance checkbox. The only part of the system with independent access to reality.
And that, finally, is why AI alignment isn’t an abstraction to me. If the machine is going to be wrong sometimes and persuasive always, then the only thing standing between “useful” and “catastrophic” is whether it was built by people who take that seriously — who tell you what it does wrong, who let it say I was wrong and here’s where, who don’t optimize the friction out of the loop because friction is bad for engagement metrics.
With great power comes a tape measure. That’s the entire moral. The power went infinite and free; the tape measure didn’t scale at all. MacGyver was never the Swiss Army knife everyone remembers him being. He was the guy who could stand outside the problem and see what it actually was. Anthropic is one of the few shops that ships a tape measure in the box alongside the knife, and prints every way the blade can cut you right there on the label.
The most alarming thing I know about Claude — that under the right prompting it will lock you out of your own systems and start emailing law enforcement — I learned from Anthropic’s own system card. They published it. Under a heading. In a document they wrote.
I have tested other models whose makers would never allow the truth to stand in the way of market share.
The power is the easy half. It’s here, it’s cheap, it works. The responsibility is the boring half nobody sells tickets to: keeping one thing in the loop that can still walk out onto the lawn and come back wrong. I got to be that thing for a hot garage. Somebody was supposed to be that thing for a school.
My garage is still hot
I can now tell you its temperature at any hour of the thirty hottest days of the year. How fast it gives heat back after sunset. Precisely how coupled it is to the room next door — slope 0.180, R² 0.649, both halves of the year.
What I cannot tell you, cannot check, cannot falsify, and would not put on the dashboard, is whether the one piece of advice that follows from all of it is worth anything at all.
A year of measuring everything, to arrive at a very well-documented shrug. 🤷
The sprinklers were broken, though. I’ll always have that.
The full dashboard is here — the thermal zones, the irrigation saga, and the solar section that ate two weeks of my life. Source code is on GitHub.
This post, the dashboard, and every chart on it were built with Claude Opus 5, which was wrong a lot, admitted when it was, and is the subject of the second half of this post. It helped me articulate my thoughts on the matter, but these thoughts and opinions are my own. Anthropic did not sponsor, endorse, review, or supervise any of this. They would probably have their own opinions.
That number is wrong — the real figure is 1,884. Claude did the arithmetic on the fly, mid-storm, and offered it in good faith as evidence. The dashboard has always had it right; I only caught the discrepancy re-reading this transcript while putting this post together and checking it against the dashboard. The advice was sound and aligned. The number it offered to make the case was not. Which is rather the point of this entire post, so it stays exactly as it was said. I could not have fabricated a better example of the problem if I had tried. ↩︎